18. Sequences
a2. Plots
To visualize a sequence we can make a table and plot it. The terms are plotted as a function of the index.
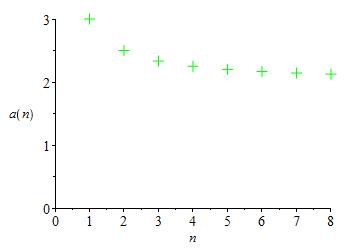
Make a table and plot of the sequence \(a_n=\dfrac{2n+1}{n}\) for \(n=1,2,3,\ldots\).
Here are the table and the plot:
| \(n\) | \(1\) | \(2\) | \(3\) | \(4\) | \(5\) | \(6\) | \(7\) | \(8\) |
|---|---|---|---|---|---|---|---|---|
| \(a_n\) | \(3\) | \(\dfrac{5}{2}\) | \(\dfrac{7}{3}\) | \(\dfrac{9}{4}\) | \(\dfrac{11}{5}\) | \(\dfrac{13}{6}\) | \(\dfrac{15}{7}\) | \(\dfrac{17}{8}\) |
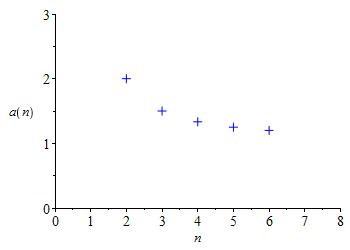
Plot the first \(5\) terms of the sequence \(a_n=\dfrac{n}{n-1}\) for \( n=2,3,4,\cdots\)
| \(n\) | \(2\) | \(3\) | \(4\) | \(5\) | \(6\) |
|---|---|---|---|---|---|
| \(a_n\) | \(\dfrac{2}{1}\) | \(\dfrac{3}{2}\) | \(\dfrac{4}{3}\) | \(\dfrac{5}{4}\) | \(\dfrac{6}{5}\) |
×
Heading
Placeholder text: Lorem ipsum Lorem ipsum Lorem ipsum Lorem ipsum Lorem ipsum Lorem ipsum Lorem ipsum Lorem ipsum Lorem ipsum Lorem ipsum Lorem ipsum Lorem ipsum Lorem ipsum Lorem ipsum Lorem ipsum Lorem ipsum Lorem ipsum Lorem ipsum Lorem ipsum Lorem ipsum Lorem ipsum Lorem ipsum Lorem ipsum Lorem ipsum Lorem ipsum